- Posts: 6332
- Thank you received: 315
Using a Star Analyser - Blog
- michaeloconnell
- Topic Author
- Offline
- Administrator
-

Less
More
10 years 11 months ago - 10 years 11 months ago #99644
by michaeloconnell
Using a Star Analyser - Blog was created by michaeloconnell
Some time ago, I bought a Star Analyser.
www.rspec-astro.com/star-analyser/
It is a diffraction grating which, to put it simply, breaks up the light from a star into its component colours and wavelengths.
I originally bought it around the time of Supernova SN2011dh in M51 in May 2011.
en.wikipedia.org/wiki/SN_2011dh
Dave Grennan generously loaned me his diffraction grating to try out first.
After giving it a go, I was intrigued and so bought my own.
After a few attempts at using it, it ended up in the bottom of my drawer until a few nights ago.
That's when I decided to dig it out and try using it with the software "RSpec".
www.rspec-astro.com/
This can be downloaded and tried out for a few weeks as a fully functioning demo.
When you attach the star analyser onto a camera and take an image of a star through a telescope, it is possible to determine the constituent gases in that star.
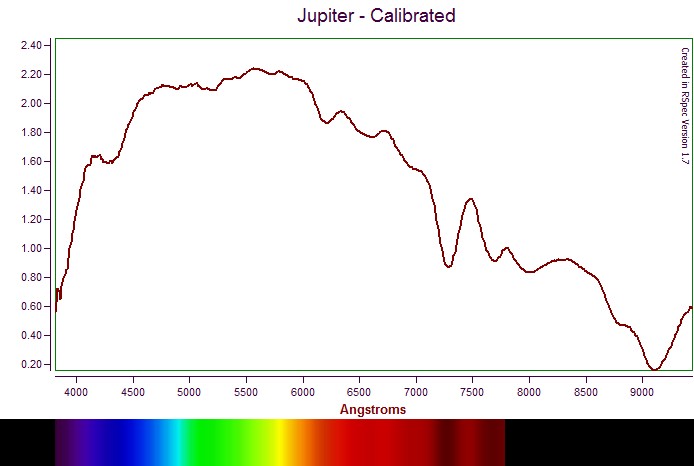
Likewise with planets. Below, in a series of posts, I will discuss how I started using it.
Last edit: 10 years 11 months ago by michaeloconnell.
Please Log in or Create an account to join the conversation.
- michaeloconnell
- Topic Author
- Offline
- Administrator
-

Less
More
- Posts: 6332
- Thank you received: 315
10 years 11 months ago - 10 years 11 months ago #99645
by michaeloconnell
Replied by michaeloconnell on topic Re: Using a Star Analyser - Blog
First step is to select a star.
It is recommended that the first star is Vega.
This is because it is a Type A star.
More on star types later....
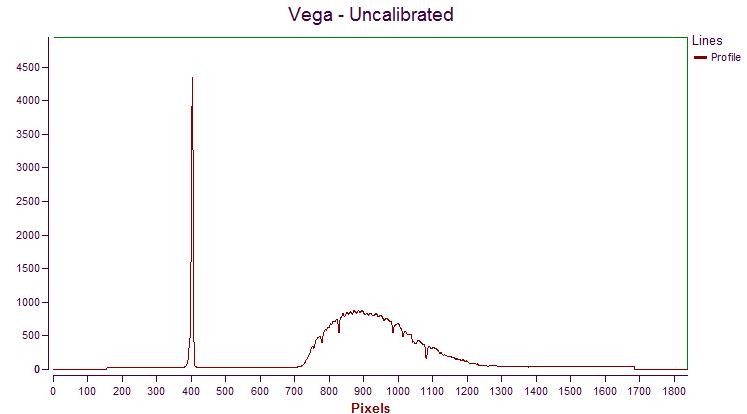
Below is a output from the software Rspec of the spectrum for Vega
below is a portion of the image from the CCD camera.
the graph shows a sudden peak on the left hand side and a gentle rise and fall on the right hand side.
Looking at the photo, you will see a bright star, which is the star Vega, and a line off to the right hand side, which is the spectrum of the star.
If you look closely at the spectrum, you will see some lines in it.
These are of interest to us as they reveal the material that is burning in the star.
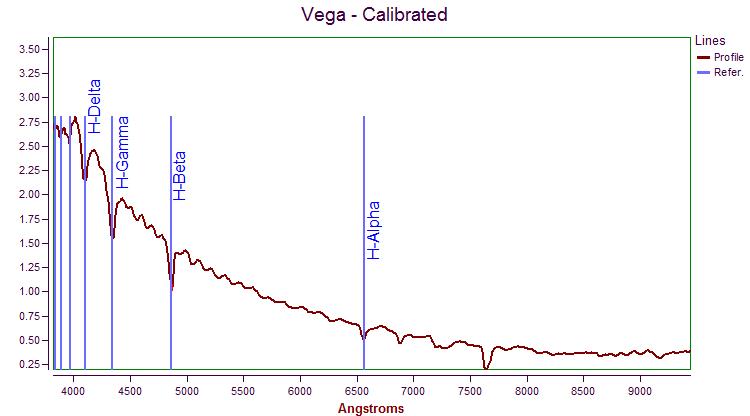
The software RSpec is able to analyse the spectrum and determine what the lines in the spectrum correspond to.
Looking at the graph, the sudden peak corresponds to the bright spot of the star and the remainder of the graph corresponds to the spectrum line.
Last edit: 10 years 11 months ago by michaeloconnell.
The following user(s) said Thank You: paddyman, mikematthews
Please Log in or Create an account to join the conversation.
- michaeloconnell
- Topic Author
- Offline
- Administrator
-

Less
More
- Posts: 6332
- Thank you received: 315
10 years 11 months ago - 10 years 11 months ago #99646
by michaeloconnell
Replied by michaeloconnell on topic Re: Using a Star Analyser - Blog
Now, there are a number of problems with the graph.
1. It is not calibrated for any known wavelengths
2. It does not take into consideration for the type of ccd camera I have.
So, to resolve this I need to do the following:
1. Calibrate the image against a standard image from a professional telescope - there is a standard version included in the software library.
If I compare my image to the library image from a star like Vega, the software is able to calibrate my photo.
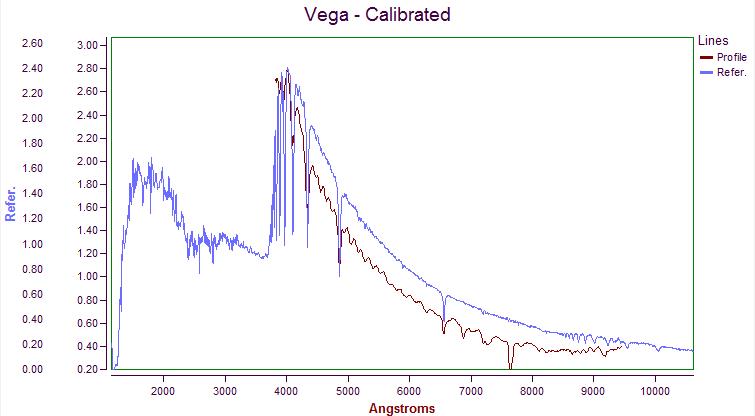
Below is the comparison:
My spectrum is in red while the library spectrum is in blue.
This tells us a few things:
1. My camera cannot see all the light from the star - this is due to the fact that any ccd camera can only see a certain range of wavelengths and the atmosphere of the earth may be blocking some light/energy from the star also.
2. Aside from that, they compare pretty well.
Last edit: 10 years 11 months ago by michaeloconnell.
Please Log in or Create an account to join the conversation.
- michaeloconnell
- Topic Author
- Offline
- Administrator
-

Less
More
- Posts: 6332
- Thank you received: 315
10 years 11 months ago - 10 years 11 months ago #99647
by michaeloconnell
Replied by michaeloconnell on topic Re: Using a Star Analyser - Blog
Last edit: 10 years 11 months ago by michaeloconnell.
Please Log in or Create an account to join the conversation.
- michaeloconnell
- Topic Author
- Offline
- Administrator
-

Less
More
- Posts: 6332
- Thank you received: 315
10 years 11 months ago - 10 years 11 months ago #99648
by michaeloconnell
Replied by michaeloconnell on topic Re: Using a Star Analyser - Blog
Last edit: 10 years 11 months ago by michaeloconnell.
Please Log in or Create an account to join the conversation.
- mikematthews
- Offline
- Proto Star
-

Less
More
- Posts: 13
- Thank you received: 3
10 years 11 months ago #99649
by mikematthews
Replied by mikematthews on topic Re: Using a Star Analyser - Blog
Fascinating! Spectroscopy and star analysis is something I'd hoped to dip my toe into at some stage in the future. Thanks for sharing!
Please Log in or Create an account to join the conversation.
Time to create page: 0.118 seconds


